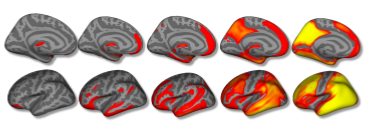
From the laboratory of Dr. Keith Johnson: these PET images show levels of tau tangles in different parts of the brain. These figures are created by combining data from many participants’ scans across various research studies. Grey = healthy brain with no tau. Red = low levels of tau. Yellow = higher levels of tau.