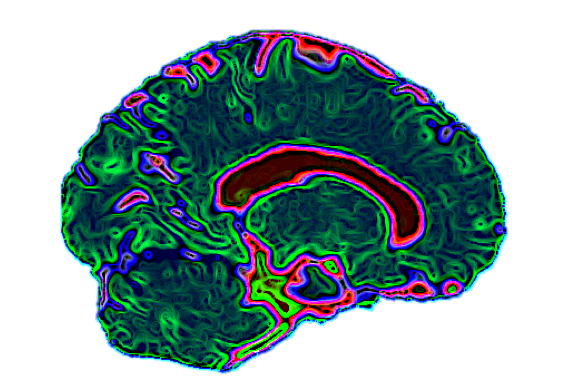
SurfPlot

surfPlot is a tool for making quick and pretty surface renderings from MNI space. This function uses the FSaverage brain from Freesurfer, and uses the standard mapping from voxel space to vertex space. Importantly this tool only works if your data is in MNI space, it cannot be used to map native space to native surfaces. There is also a surfPlot2 function which can be used to directly render surface data, so if you just used GLM_Flex_Fast2 to run an analysis on a set of thickness maps, you can use the surfPlot2 function to render the results on FSaverage.
Since not everyone will have a freesurfer install I went ahead and bundled the relevant information needed to perform this mapping into a set of mat files that are included with the distribution of these tools.
The surface plotting function has also been integrated into FIVE, so you can quickly and easily create surface renderings from whatever data you are looking at in FIVE. In FIVE various plotting/rendering options can be selected from Parameters-Surface Options
Here’s how to use the tool in full manual form (note details from this example can also be found in ExampleSurfRenderScript):
%%% Specify an input image
obj.input = 'FA_002.nii';
obj.figno = 1; % Figure number for output plot
obj.newfig = 1; % Specifies whether or not to re-render the surface or to add to existing render
obj.overlaythresh = [70];  % Specifes the threshold to be applies
% obj.overlaythresh = [-70 70];  % Can also be specified as two sided threshold
obj.colorlims = [0 inf];  % Set the color limits to be used inf and -inf are translated to min and max values
obj.colomap = 'hot';  % Choose your color map:  See colmap.m for options
obj.direction = '+';  % sets direction of one sided threshold + = greater than -= less than
obj.reverse = 0;  % Option to reverse the image; i.e. m*-1

%%% Use either these:
obj.mappingfile = []; % if no mapping file is specifed mapping is done by an average of the nearest neighbors
obj.nearestneighbor = 0; % if = 1, only the value from the closest voxel will be used, useful for maskings and label images
obj.round = 0;  % if = 1, rounds all values on the surface to nearest whole number.  Useful for masks

obj.fsaverage = 'fsaverage6';  %% Set which fsaverage to map to e.g. fsaverage, fsaverage3, fsaverage6
obj.surface = 'pial';          %% Set the surface: inflated, pial, or white
obj.shading = 'curv';          %% Set the shading information for the surface: curv, sulc, or thk
obj.shadingrange = [.1 .7];    %% Set the min anx max greyscale values for the surface underlay (range of 0 to 1)
obj.Nsurfs = 4;              %% Choose which hemispheres and surfaces to show:  4=L/R med/lat;  2= L/R lat; 1.9=L med/lat; 2.1 = R med/lat; -1= L lat; 1-R lat;

%%% h1 =  underlay handles
%%% hh1 = overlay handles
[h1 hh1] = surfPlot(obj);

%%% Add a second overlay to the first endering
%%% A second overlay can then be added by changing a few fields of obj and
%%% passing obj to surfPlot.
obj.input = 'FA_003.nii';
obj.colomap = 'cool';
obj.newfig=0;
obj.reverse=1;
obj.overlaythresh = [50];
obj.colorlims = [50 inf];
[h2 hh2] = surfPlot(obj);
shg

set(hh1,'FaceAlpha',.85)
set(hh2,'FaceAlpha',.85)
To use this in FIVE, open an image, set your preferred thresholds, colormaps, and transparencies (note the cluster extent threshold will be ignored), and then choose option-Plotting-Surface Render.
Each surface is rendered as a 3D patch object, so you can rotate and manipulated each object in the matlab figure. You can also set the orientation using the matlab view.m function (e.g. view(0,90) ).